Hello,
At the beginning of this year, I started working on a project for horizontal jumps to use in my training group. We needed something to use during winter training that could help us understand how athletes are improving in TJ / LJ. I have written a small description of it in this post:
A Hybrid, Multi-Sensor Tracking System for Triple Jump Performance Analysis (A Tracking System for Triple Jump Performance Analysis - Loops, Logic & Syntax)
The system is currently in the design stage, and I have been working on the design documentation and experimenting with relevant libraries in Python. The system comprises both hardware and software.
Given the nature of this competition, I decided to stay within the same topic and focus on horizontal jump analysis for field competitions providing visual cues for spectators or viewers.
As my background is in horizontal jumps, I will focus on these events for the prototype. If successful, the same methodology can be applied to other field events.
Following is my idea. I will need to do some work in the coming days to refine it.
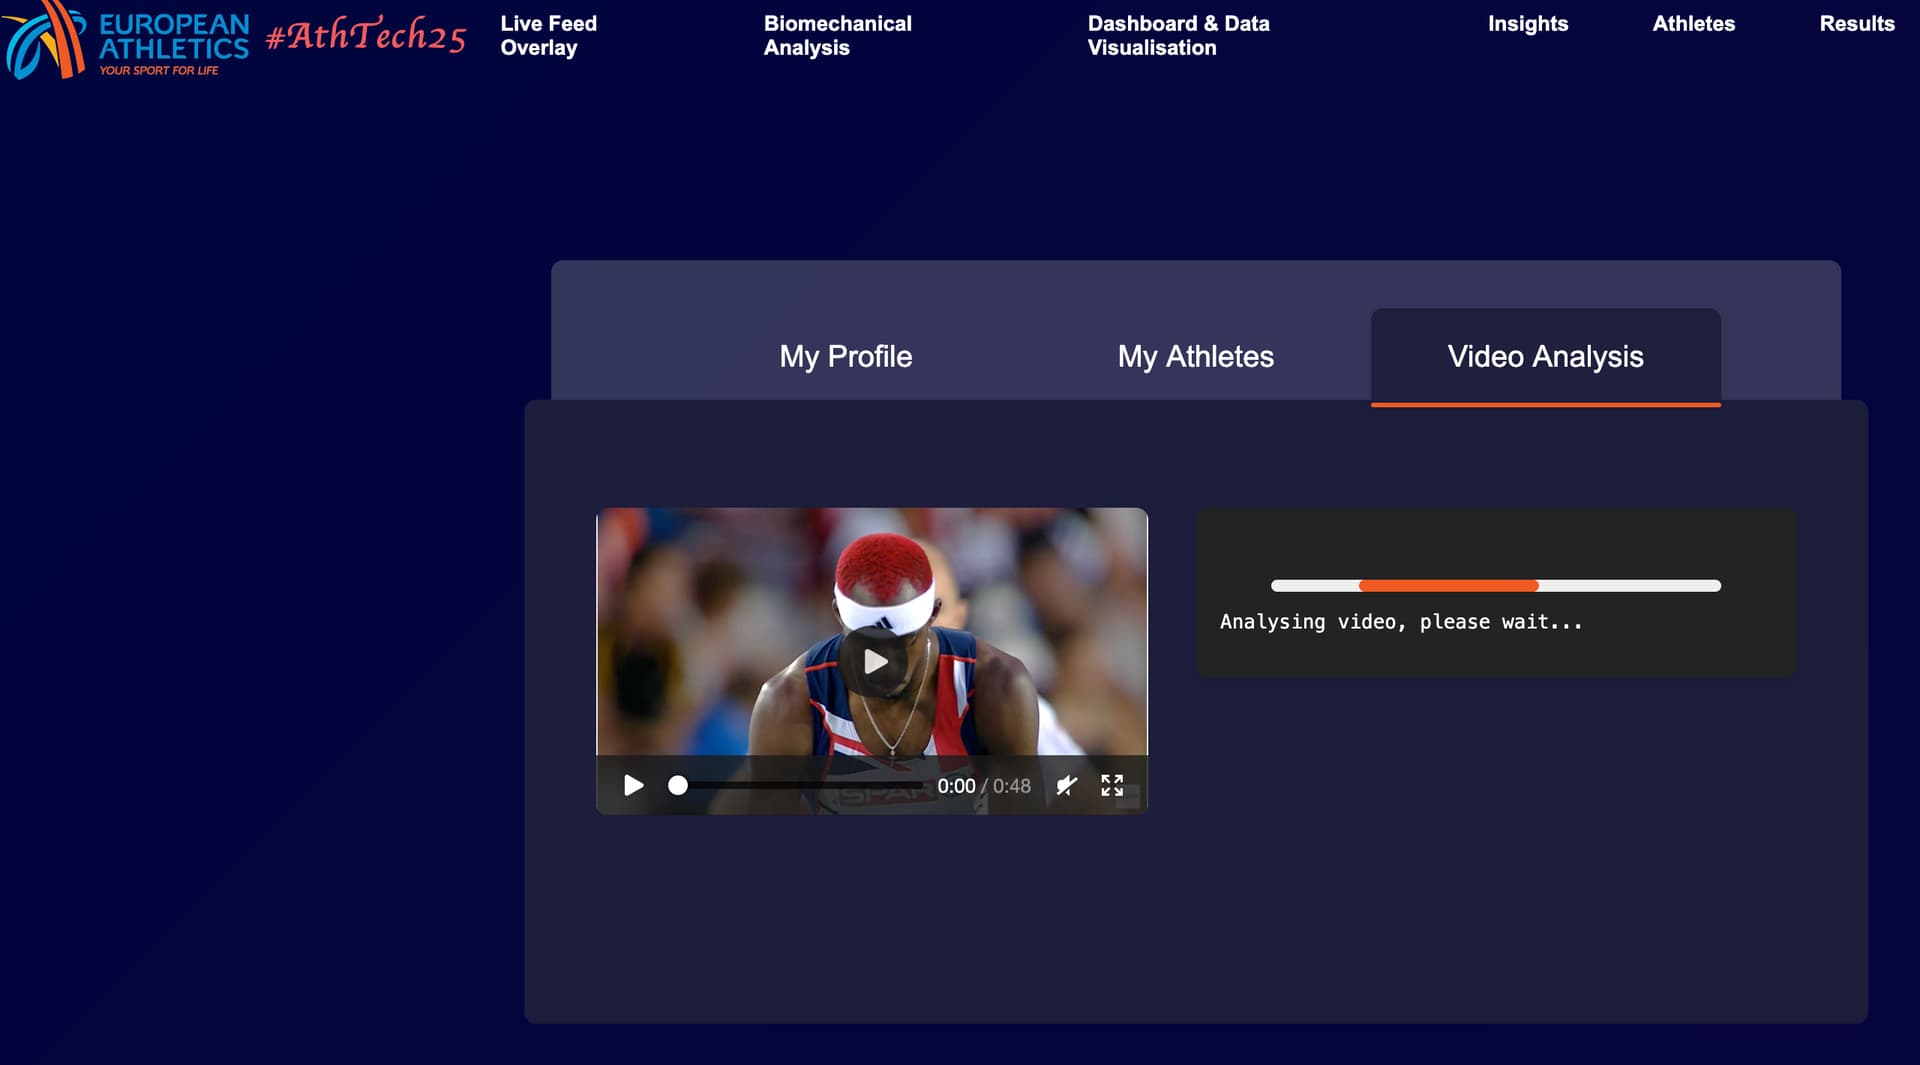
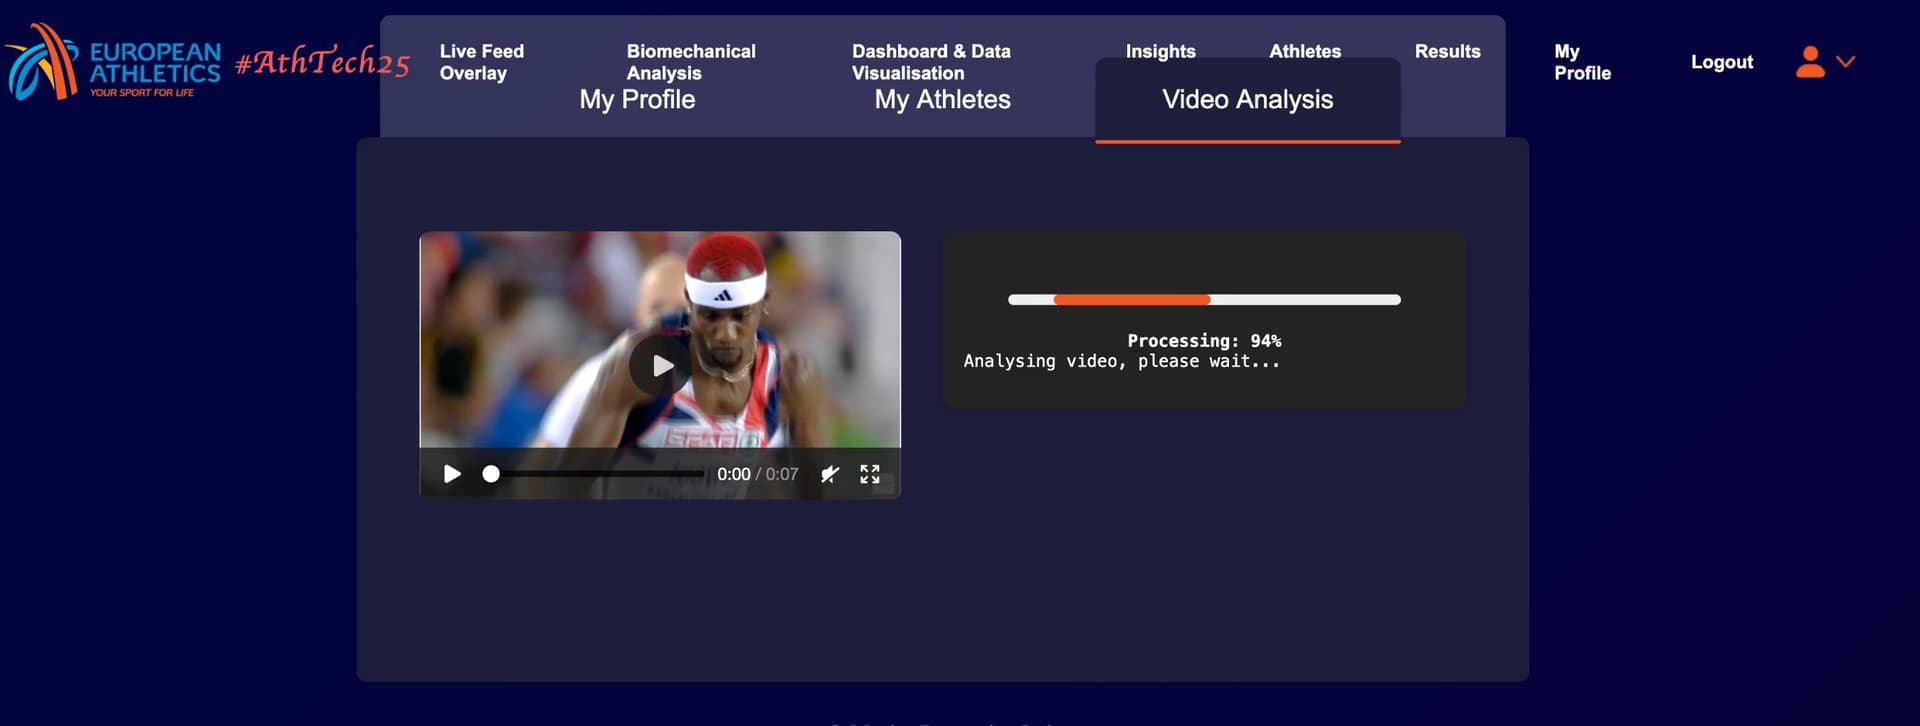
JumpLens - Real-Time Horizontal Jumps Analysis and Comparison for Competitions
With this project, I aim to improve the viewers’ experience by using data visualisation tools to make field events more engaging.
Each athlete’s attempt is analysed to extract metrics (e.g., acceleration, speed reached takeoff, time of flight if possible, etc.). Using these data, feedback is provided to compare the current attempt with the previous one (if it exists).
A comparison with the athlete ranked higher on the leaderboard is also performed, giving information into what differentiates their best performances.
This project also aims to support athletics commentators in storytelling the event, helping viewers better understand the technical aspects of each performance in real-time.
Or what differentiate an athletes performance from the other.
Main features:
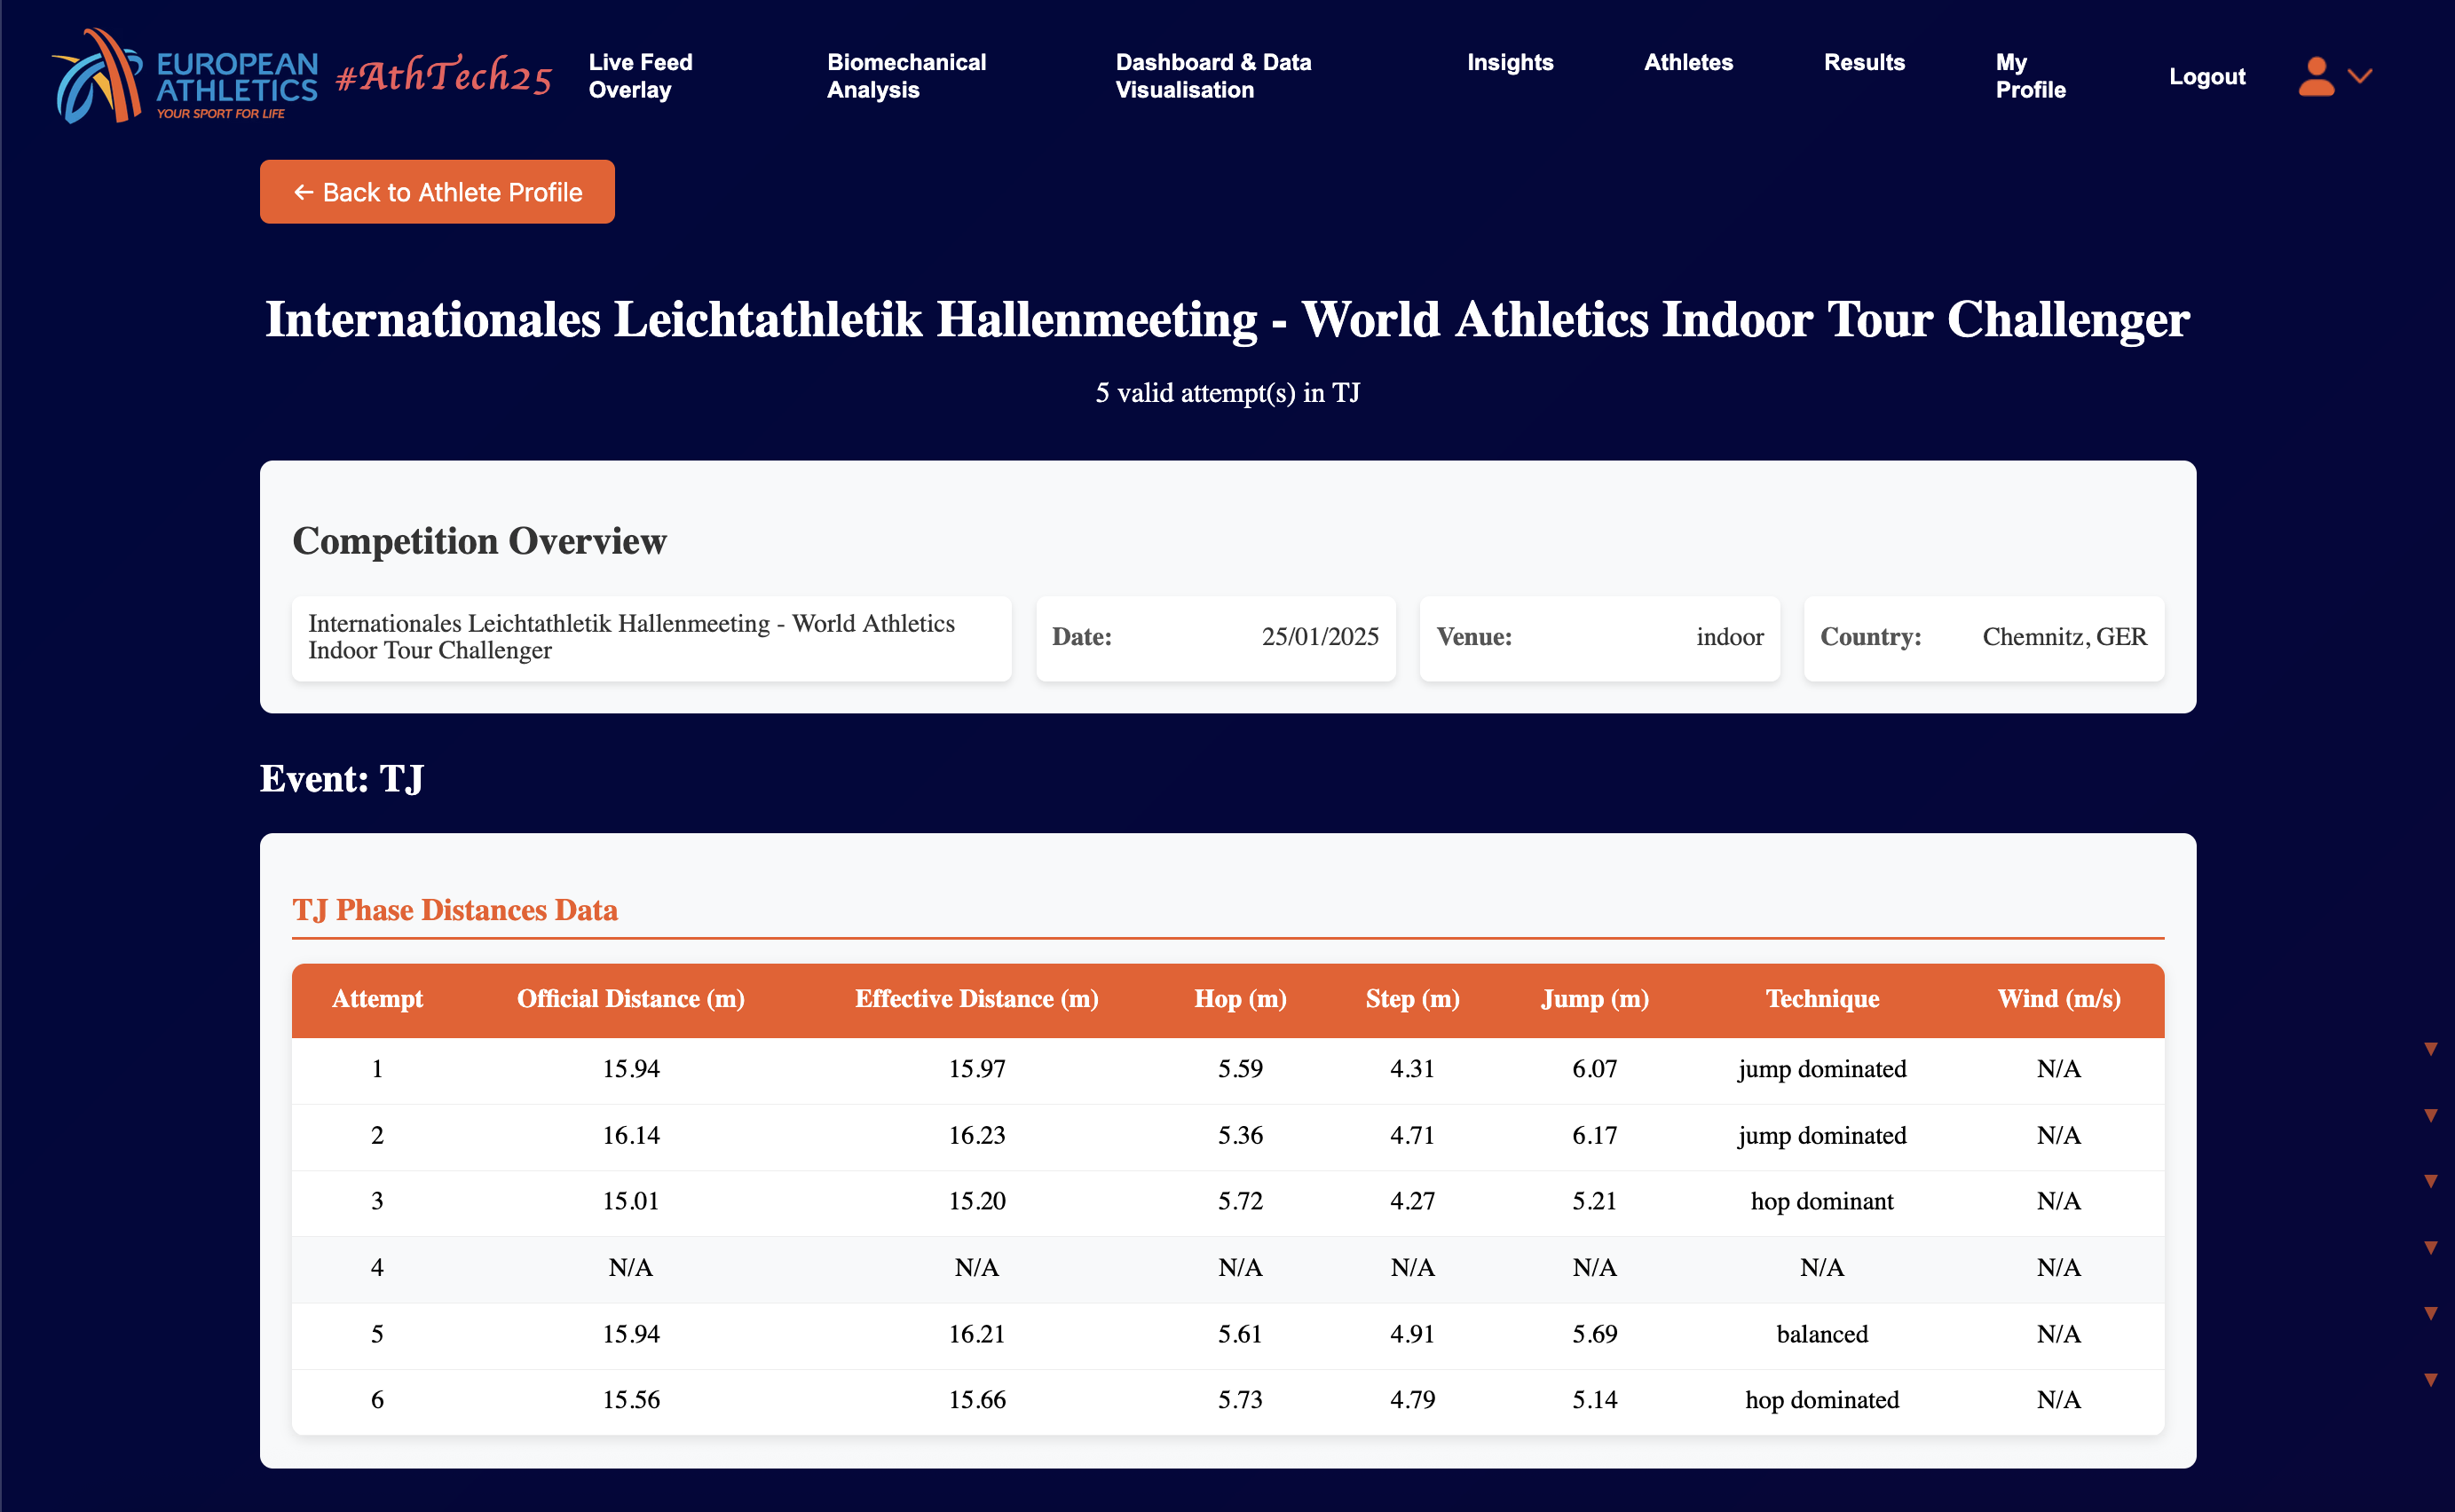
- Real-time or (near real-time) data visualisation of athletes’ attempts, including metrics such as speed, acceleration, and phase distances (e.g. for TJ hop, step, and jump, if tracking these phases is possible).
- Comparison of each attempt with the athlete’s previous ones to point out improvements or declines in performance.
- Comparison with other athletes, so that the spectator can understand what distance is needed for the athlete to move up in position.
- This data discovery help spectators/viewers better understand how athletes differ in technique and execution.
- Any other data visualisation technique to make the competition more engaging and easy to follow. This would depend on the quality of the data feed to the software.
Data needed:
Usually, some of the data I described are tracked during competitions. (If not, further computer vision technique should be considered?) This data would feed into the software to produce the outputs described above.
If sample data is available, I will experiment with it for development and testing. My next step is to identify the open data sources available for use.
Thank you.
Best wishes